
A SYSTEMATIC TRADINGVIEW FRAMEWORK DESIGNED FOR TRADERS WHO WANT CLARITY, NOT NOISE.
Decision quality.
Not signal
quantity.
Built for scalpers, day traders, and swing traders across stocks, ETFs, crypto, forex, and other TradingView-supported markets.
HelixStrat was designed to turn market noise into a competitive edge. The system analyzes trend strength, setup quality, momentum, volatility, key levels, and market context in real time, then simplifies everything into one Trade Probability Score and a clear decision label. The result is a powerful edge for cutting through noise, identifying stronger setups, and bringing a repeatable decision framework to every chart.
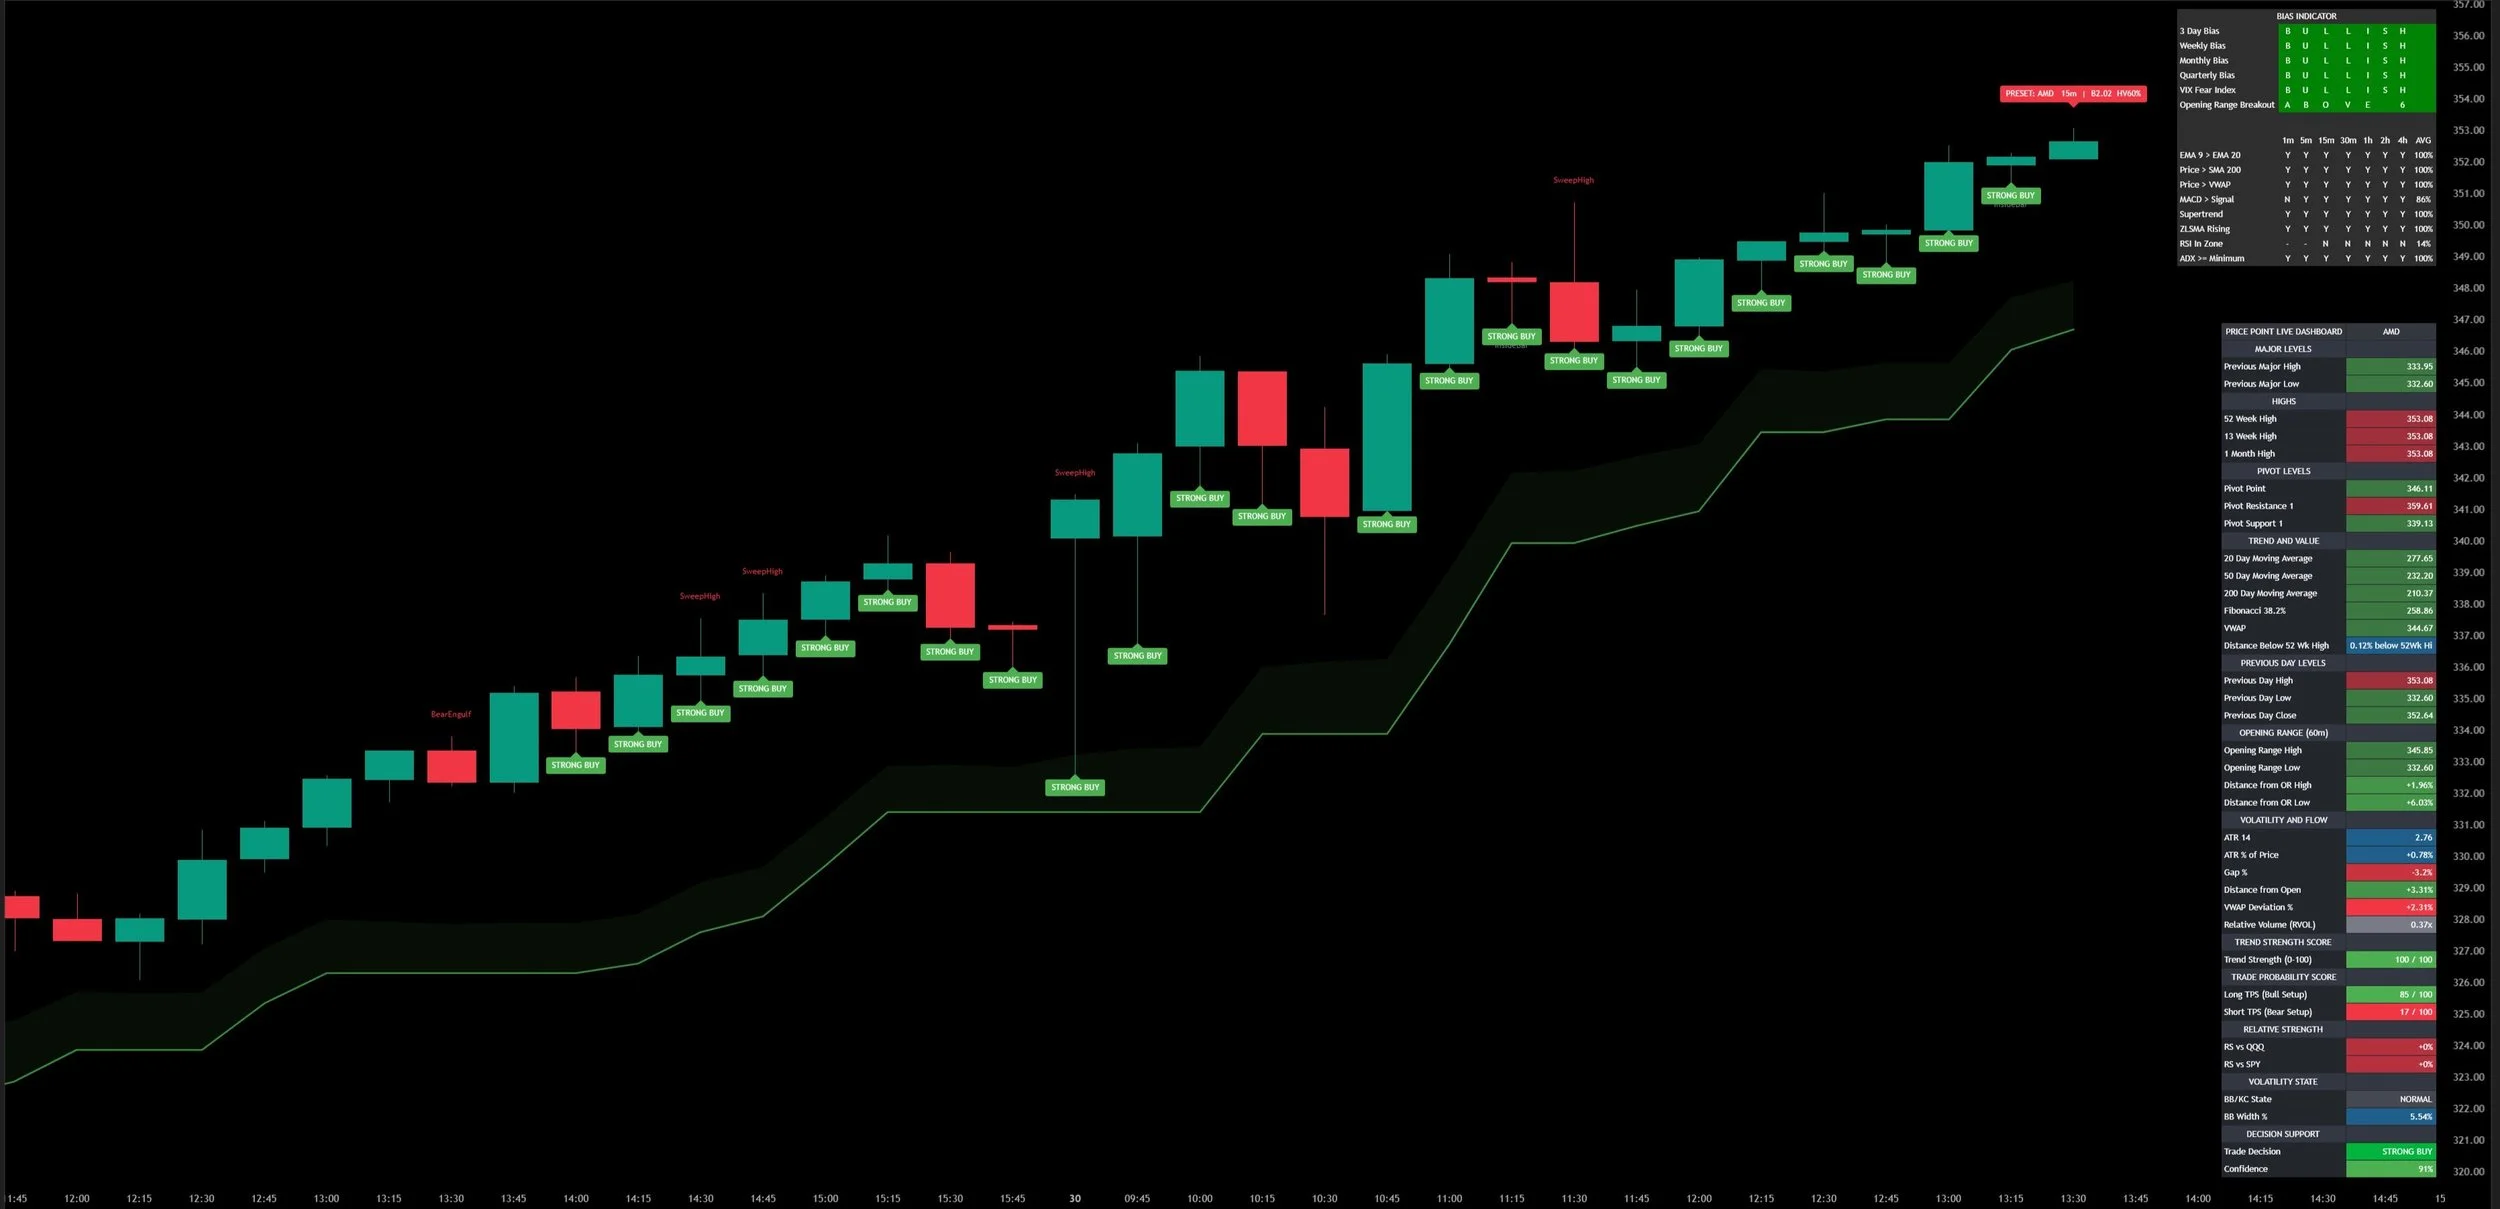
HELIX MTF INDICATOR
The HelixStrat Framework.
The Indicator handles real-time market context. The Strategy handles structured execution and capital protection. Both run on the same TradingView chart.
Real-time market context.
Multi-timeframe bias, key levels, scoring, decision support, and high-conviction signal labels all in one overlay.
● Multi-Timeframe Bias Table across 1m → 4h plus 3-Day, Weekly, Monthly, Quarterly
● Price Point Live Dashboard with all major levels, pivots, MAs, and ATR
● Trend Strength Score (0-100) and Trade Probability Score (0-100)
● Trade Decision + Confidence % rolled up onto every bar
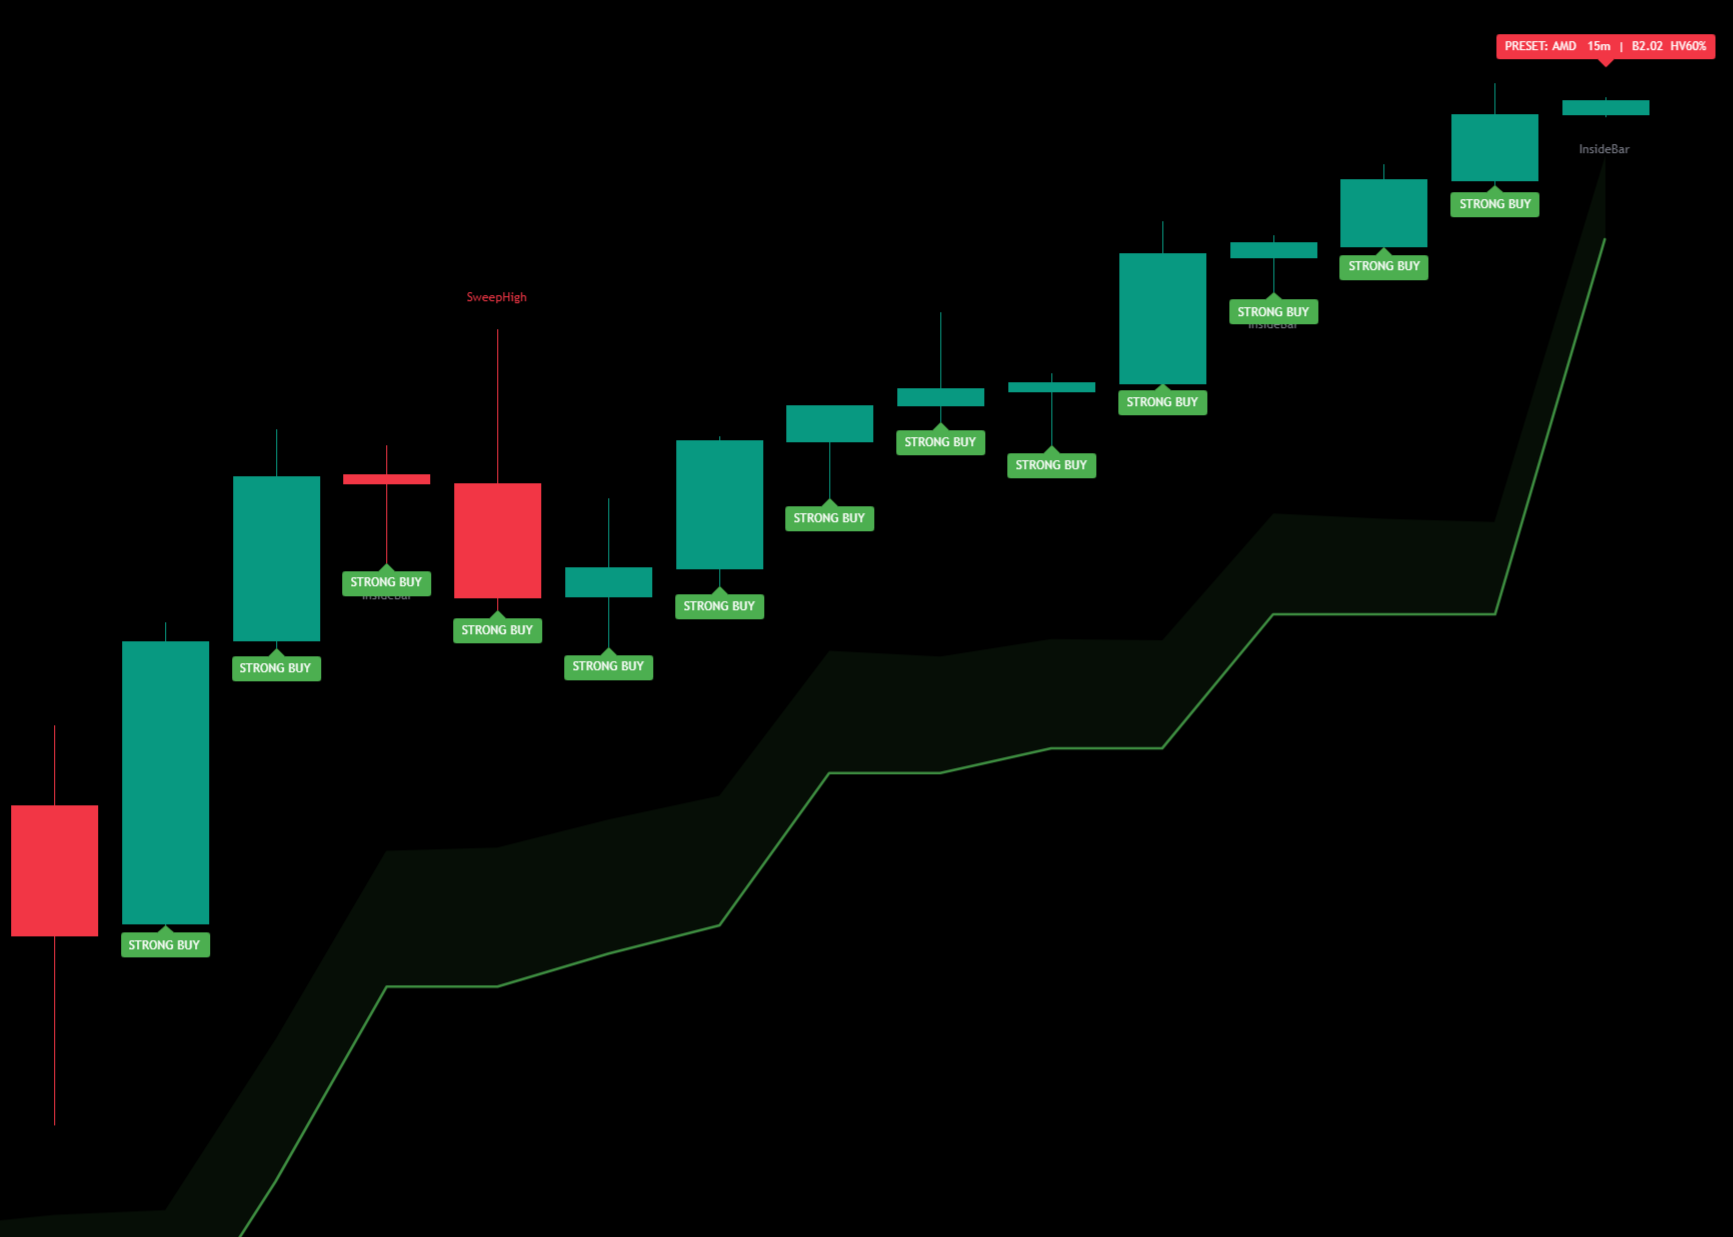
● STRONG BUY / STRONG SELL chart labels filtered for confluence
● Liquidity Sweeps, Volatility State, RS vs QQQ & SPY, candlestick patterns
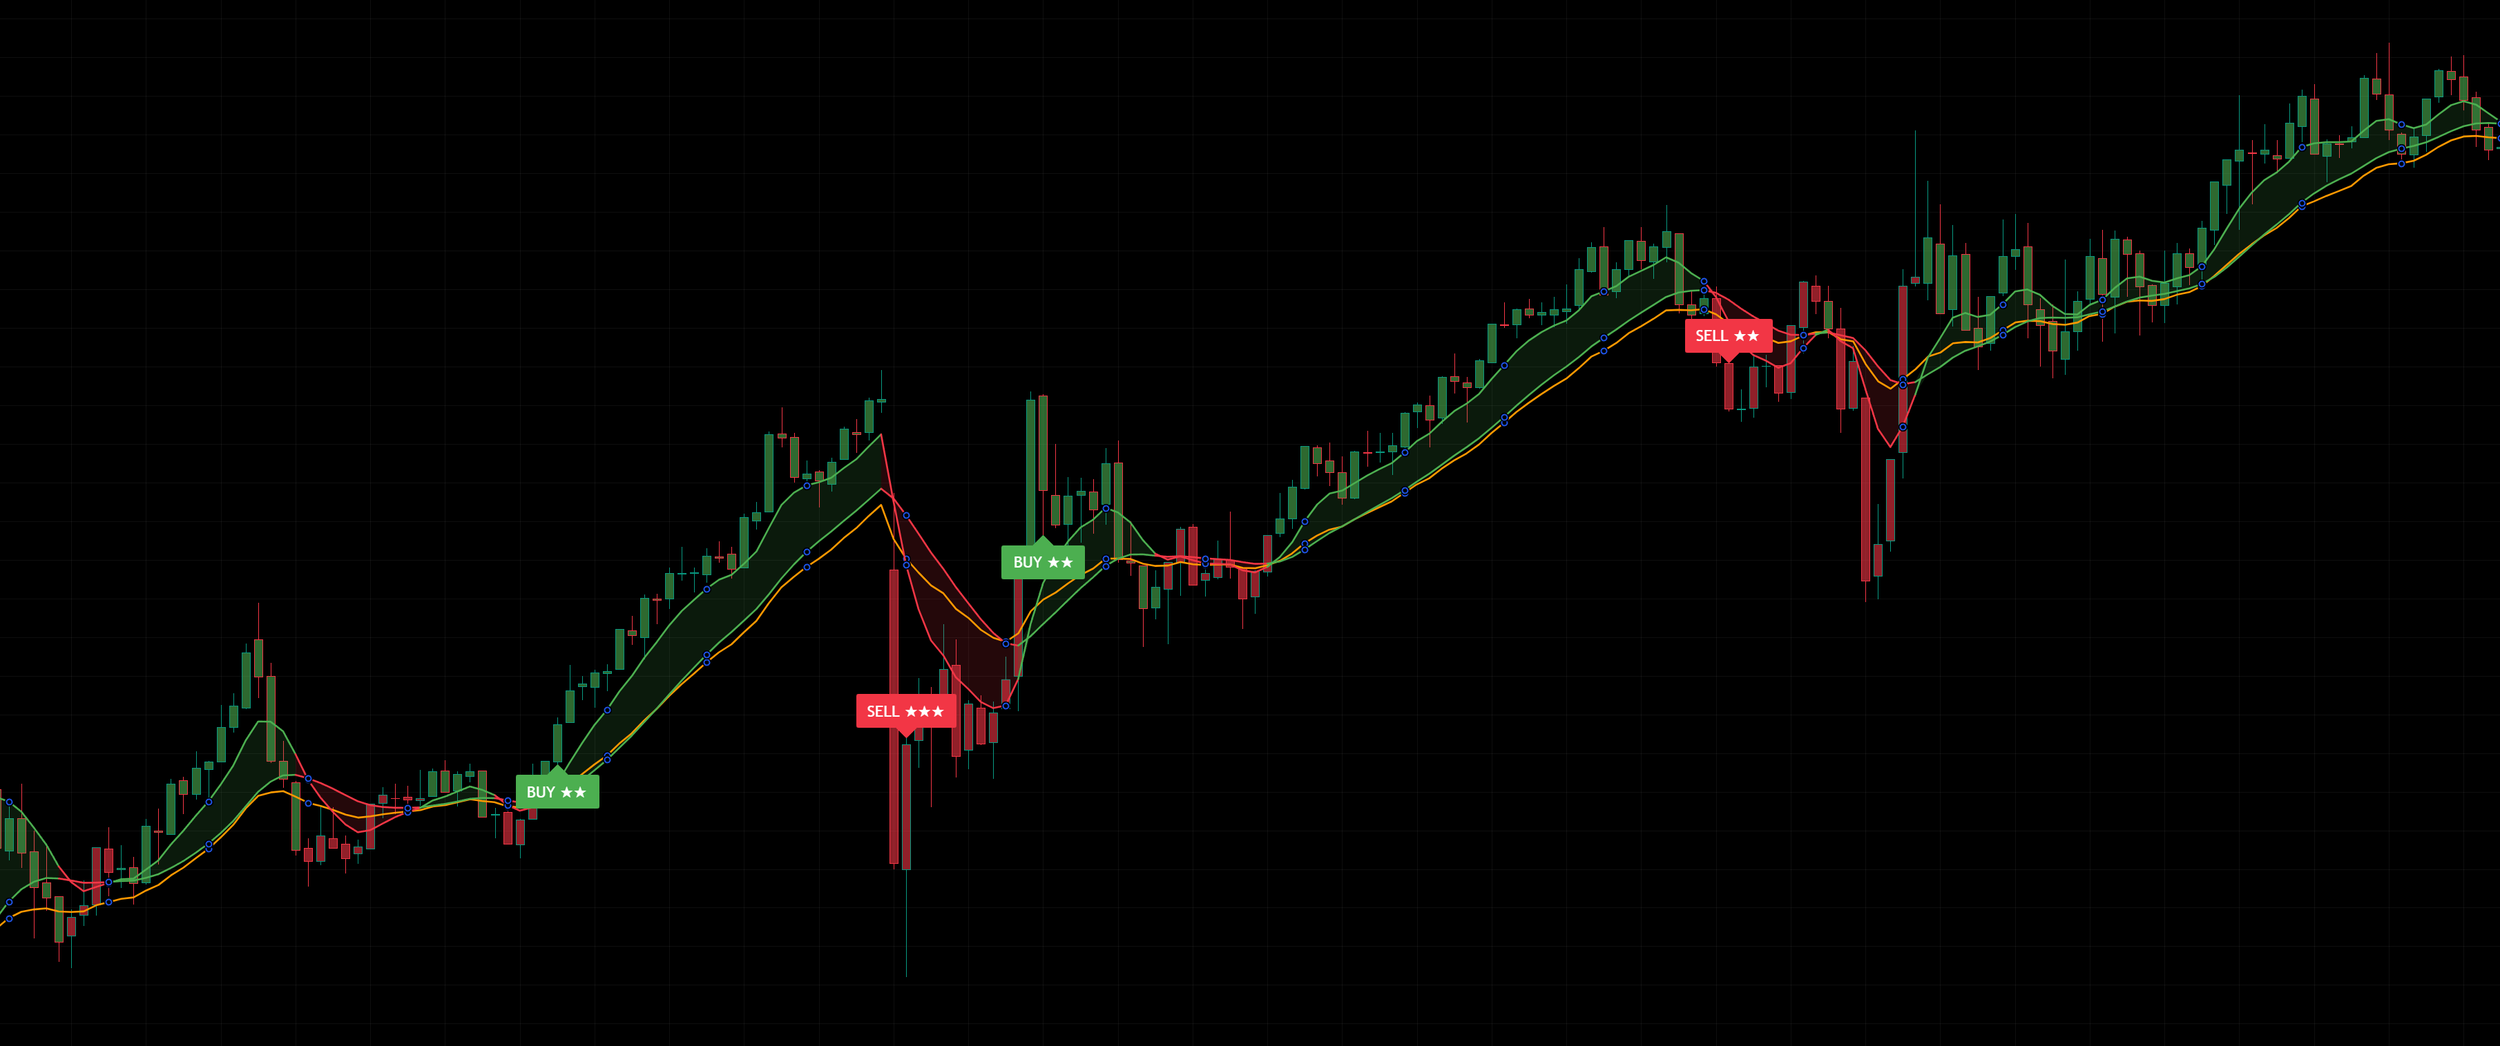
HELIX ADAPTIVE STRATEGY
Structured entries & exits.
Star-rated signals, three-leg trade management, and six layered capital protection systems with deterministic priority.
● Quick Setup: Trading Profile × Risk Level configures everything in one click
● Auto Mode picks Profile from chart timeframe automatically
● BUY / SELL labels with 1-5 star quality ratings - gate by minimum stars
● Three-leg lifecycle: TP1 → breakeven, TP2 → trail activates, TP3 → runner
● Six safety systems: Drawdown Cap, Circuit Breaker, Regime Flip, EOD, Cooldowns, Daily Loss
● Live Performance Table + Quality Grades - self-auditing strategy
APPROACH A
Cluttered indicator stacks
Eight tabs, six panels, a dozen overlays - and they all argue with each other.
Each indicator works in isolation, with no shared scoring logic.
Multi-timeframe context requires manual checking across charts.
Conflicting signals are common - trend, momentum, and volume disagree.
No structured trade decision label, confidence, or volatility state.
Risk management is bolted on after the fact, if at all.
The cleaner your chart, the less you can read.
Three approaches, side by side
Indicator stacks. Generic signal tools.
Then there is HelixStrat.
Each approach tries to solve the same problem - turning a chart into a decision. They don't all do it the same way.
APPROACH B
Generic signal services
A single arrow, a single label, no context - and no way to grade quality.
BUY/SELL signals with no transparent scoring logic.
No multi-timeframe bias surfaced on the chart.
No grading of setup quality - every signal looks identical.
Position sizing is the user's problem, not the tool's.
Risk controls (drawdown, daily loss, cooldowns) are typically absent.
Designed to look right, not be readable.
HELIXSTRAT
One structured system
An Indicator that scores the chart. A Strategy that acts on it. Both designed for the same workflow.
Multi-timeframe bias on chart - 11 rows from 1m to Quarterly + VIX.
Trend Strength Score, Trade Probability Score, Decision, Confidence - surfaced on the chart.
Star-rated BUY/SELL labels with adaptive position sizing per quality band.
Three-leg trade management - TP1, TP2, TP3 with breakeven and trail.
Six layered capital protection systems - drawdown, circuit breaker, daily loss limit, cooldown, EOD, regime flip.
Dashboard-driven workflow designed to surface a single, readable answer.
STEP 1 - SCORING
Every signal scored.
Every decision documented.
Twelve components.
One score.
The Trade Probability Score evaluates 12 weighted factors, including multi-timeframe alignment, EMA structure, VWAP location, MACD momentum, Supertrend direction, ADX strength, relative volume, ORB status, relative strength, volatility state, and key-level positioning.
Instead of relying on one signal, HelixStrat scores the full setup environment so traders can see whether the data is aligned, mixed, or not worth acting on.
● 12 transparent, weighted components
● Separate bullish and bearish setup scoring
● Trend Strength Score confirms the market environment
● Live scoring with bar-close confirmation options
STEP 3 - STRATEGY
Capital protection,
engineered first.
The Helix Adaptive Strategy is a separate, backtestable trend-following system designed to enter only when trend direction, momentum confirmation, signal quality, and market-condition filters align.
Positions are managed through a three-leg exit model, while independent safety systems monitor drawdown, adverse volatility, regime flips, daily loss limits, cooldowns, and end-of-day exits.
● Gaussian Ribbon trend direction with momentum confirmation
● Star Rating quality gate before entry
● Three-leg position management with breakeven and trailing logic
● Priority-based forced exits for drawdown, volatility, regime flips, and end-of-day close
HOW IT WORKS
STEP 2 - DECISION
One decision.
Six possible states.
TPS, TSS, volatility state, and relative strength feed into the Decision Engine, which classifies the current setup as STRONG BUY, BUY, NEUTRAL, SELL, STRONG SELL, or AVOID.
AVOID is not a failure state. It is a protection state used when the data is not strong enough, when conditions are mixed, or when the setup does not justify action.
● Strong Buy / Buy for bullish alignment
● Strong Sell / Sell for bearish alignment
● Neutral when conditions are mixed
● Avoid when the setup does not meet the confidence threshold